Chapter 10
TOC Home Previous « Glossary Off
Doppler Effect
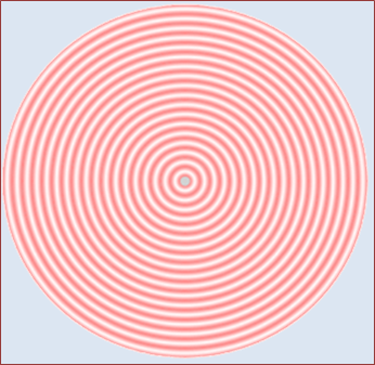

The picture on the left above is a bird’s eye view of a train whistle while a steam locomotive sets idle at a boarding platform. It is a plan view of a slice through the acoustic sphere while sound radiates from the steam whistle as air is compressed and decompressed. Dark circles indicate compression while lighter circles show decompression, and somewhere between is ambient air pressure. The engineer has signaled that he is ready to pull away from the platform.
A few years before Christian Doppler published his work on the changing color of binary stars, people along the Ohio and Mississippi rivers recognized a slight changing tone a whistle made as a steamboat came at them then moved away. Later people along railroads would hear the same changes but at a quicker pace. Trains, even in their infancy, moved faster than any other transportation means. Unknown to the observers at the time, that change in frequency would become known as the Doppler Effect.
The frequency of light and sound changes with respect to an observer’s movement. It seems there are various explanations for these phenomena, some of which are confusing. We hope to clear up some of the muddle. While chasing rational for the redshift of binary stars is a daring proposition, we will begin at a much slower pace. Since sound covers less distance in the same time period, our discussion of the Doppler Effect will began there.
Sound, radio, and light wave lengths are measured in meters. So instead of mph, we measure the speed of a train in kilometers per hour. For those interested, multiply miles per hour by 1.609344 to convert mph to kph. That is, 60.000000 mph is equal to 96.560640 kph. The significance must be great because later the time periods will be in billionths of a second or nanoseconds. Doing this up front saves a lot of ink and messy reading.
To keep things simple, we’re using an old train with a single note whistle. Say a train is approaching you head-on at 90 kph. The engineer pulls the cord. The whistle blows. The leading edge of the first cycle leaves the engine heading towards you.
For the full explanation, we need to know how far the train moves in a fraction of a second and how far the first acoustic cycle has moved in a full second.
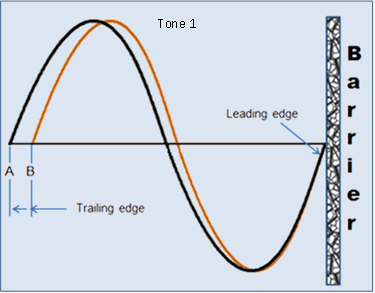
Tone 1 indicates what happens when that train is traveling towards you with a whistle frequency of 512 Hertz. The graph is a sine wave representing the air as it gets compressed and decompressed slightly as the wave begins its journey, the higher the amplitude the more dense the air. It crosses the horizontal line which represents ambient air and then goes negative to indicate less density. We’re talking one cycle only.
Position A is when the engineer pulls the cord. The whistle sends the leading edge of the wave away in all directions. We only care about what’s headed our way, so we slice that portion out. If the engine were not moving, the wave would appear as the image shows beginning at A, but the train is moving. In one split-second, the whistle’s leading edge has moved forward, but in that same split-second the train has also moved toward B. A lot happens during that first period. The mechanism generating the sound continues its motion as the wave forms. Each portion of the wave moves closer to its leading edge because its speed has maxed out. At the end of the time period, the length has shortened by the distance the train has moved. A shorter length means a higher frequency.
Recognize that the process creating the tone is continuous. It may seem fast, but it is not done in an instant. Sound waves do not jump off the generating mechanism in the form of cycles. The device creates them, bit by bit, nonstop until some action turns the apparatus off. This concept will be more important when we consider light waves. They are also generated over distance but at a much smaller scale—billionths of meters instead of thousandths of meters.
Most references use time, but for our purpose, we need to express that distance is also a representation of time. And we must sway that light and sound are generated over distance. Most programs presented on television about the universe will always mention space-time. Since space implies distance, we will use distance in our description.
The barrier is the speed limit of sound for this material, air. The wave doesn’t stop there. It continues to propagate away from its source at the speed allowed by the medium. The above depiction represents everything that happens in the first acoustic cycle. Everything shifts to the right to make way for another cycle, another period, and the train moving farther along its tracks. An important thing to grasp is that the next cycle begins at position B, and repeats for each cycle for as long as the whistle blows.
You probably have a good grasp of the Doppler Effect at this point, so if a little math bothers you feel free to jump to Chapter 11. But if it doesn’t, and you are interested in how much tone or frequency changes with respect to a change in speed, please continue. It will be worth it.
A little arithmetic is necessary to set this up for a standard day in air because the speed of sound varies a little with temperature, atmospheric pressure, and density. The standard day under consideration is 29.92 inches of mercury at 59 degrees F plus density and viscosity.
Speed of sound in air = 342 meters / second. An alternate spelling is metre used by our European friends.
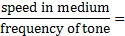
For our discussion, we need to know the wave length of the whistle and how far the train moves in one split-second. The frequency is 512 Hertz or to some of us older guys 512 cps (cycles per second). The formula for finding the wave length is,

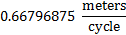
or 667.96875 millimeters. Another reason for the greater precision is because this value is used later when determining how much the train has gained on the cycle’s leading edge. Further, the tags are in place for those who may ask, “Where did the seconds go after dividing?” They cancelled leaving meters per cycle where cycle is usually dropped from the conversation. Cps or c/s was used during the calculation instead of Hz to gain a bit more understanding (no disrespect to Heinrich Rudolf Hertz who was the first person to provide conclusive proof of the existence of electromagnetic waves.) The lower case Greek letter lambda λ or upper case Λ is used to cut down on typing in future references to wavelength.
Now that we know the wave length, the next task is to find how far the train moves during one cycle of the whistle tone. Ninety kilometers (90,000 m) per hour must be divided by the number of seconds in an hour (3,600).
![]()
The whistle (on the locomotive) is traveling along the tracks at 25 meters per second. But how long must it move at this speed before the next acoustic cycle begins? That is to say, how much time does the train have before the next cycle interrupts the process? For that answer, it is necessary to determine the time it takes for one cycle of the tone to finish. The tone is 512 Hz. One cycle takes
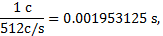

That’s 1953.125 microseconds or millionths of a second.
Therefore, the distance the train moves in that same time period is
![]()
![]()
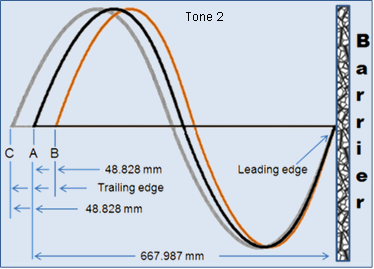
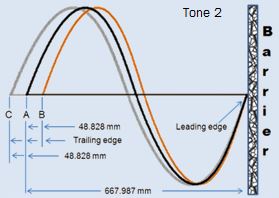
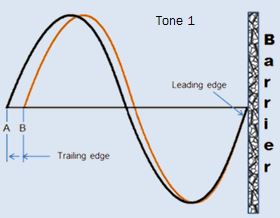
The letter A in Tone 2 points to the trailing edge of a cycle of 512 Hz while the train is at rest, and B points to the trailing edge of the same cycle at the end of one period when the train in moving at 25.000 m/s. The length of A to B represents the distance gained by the trailing edge for that one cycle.
Wave length of the new tone is
667.987 – 48.828 = 619.159 mm.
The new frequency is found by dividing the speed of the wave by its length, that is,
![]()
As the train approaches, the tone is higher—approximately 552 Hz. As it buzzes by, the tone is the original 512. As the whistle moves away as marked by C in the above image, it stretches the wave by the same amount it had squeezed the tone earlier. The sound is lower at approximately 477 Hz. without showing the arithmetic.
We used the easiest parameters for our demonstration to avoid complications. The train was coming head-on, passing at 90 degrees, and then receding at 180 degrees. We were at its six-o’clock when it disappeared.
Since our subject is about how sound changes in frequency with speed, we will not go into its other attributes like harmonics, beat frequencies, or heterodynes. Please check out these interesting characteristics on your own. The internet is a great place to visit for those subjects.
There is another property of sound to consider. We mentioned barrier earlier, but that barrier is only good for that particular medium. If two people are carrying on a conversation inside a Concord cruising along at 1320 miles per hour, they still hear each other fine. So you might say that that sound is traveling at 1320 + 765 = 2085 mile per hour. You would be right. But air inside the airplane is traveling at 1320, so the sound is still only going 765 in its medium.
Wavelength of light varies exactly like that of sound except at a blinding speed. And rather than a tone, it is the color that changes. When comparing light to its acoustic cousin, a red hue would be like a bass note while a blue hue would be like a treble tone.
Light emitting electrons do not change orbitals in an instant. Like sound generators moving along tracks, light generators move along space. It takes time for an electron to move to a new position closer in or farther away from its nucleus. And the distance traveled while emitting a packet of light is measurable. Say the electron drops from level 6 to level 4 skipping level 5. It will only emit that light energy during the transition. The frequency of light given off by any electron transition is cataloged and known quite well: the higher the orbital, the greater the energy and the corresponding frequency; the greater the distance between the orbital transition, the longer the change takes, and the longer the time period, the more energy stored in the packet. That is, the higher frequency last a lot longer which delivers much more energy than a shorter time packet. Two things are working to assure more energy: longer time period, and higher frequency. It works something like a watt meter. Utility companies charge customers by the amount of electricity used and by the period of usage. It’s known as the kilowatt hour.
The only things that change in the above picture are the time scale and reference to color instead of tone. The time scale is usually in nanometers or some part thereof. This subject will be addressed in greater detail later.
Please don’t hate the author, but the previous text was intended to provide the why and how frequency changes with speed and location. This is a bases for understanding light waves later. There is a much easier way to calculate the change in frequency (audio only; not light) but doesn’t convey much of the why’s and how’s.
It is
![]()
where vs is speed of sound, Vo is velocity of oncoming object, fo is original frequency, and f is new frequency.